Western Australian Alliance to End Homelessness Dashboard |
|
Addressing underlying drivers of homelessness in WA
Target 4
The underlying causes that result in people becoming homeless have been met head-on, resulting in a reduction by more than half in the inflow of people and families into homelessness in any one year
The causes of homelessness are complex, encompassing a broad range of individual and structural determinants, including housing availability and affordability, economic and employment opportunities (or lack thereof), physical and mental health outcomes, domestic and family violence, and social and community connections.
Housing affordability
Indicators |
Most current values |
Trend over time |
|---|---|---|
Proportion experiencing household stress in Perth (2017 - 2020)1 |
10.7% |
Increasing |
Proportion of low-income rental households spending more than 30 per cent of their gross income on housing costs (2019-2020)2 |
Perth - 36.7%
|
Decreasing |
Proportion of low income households remaining in housing stress from one year to the next (2017-2020)1 |
Australia – 48.3% |
Increasing |
Housing affordability (2019-2020)2 |
Owner – 2.9% |
Stable |
Owner with a mortgage – 14.0% |
Decreasing |
|
Renter – private landlord – 17.4% |
Stable |
|
Renter – state of territory housing – 20.9% |
Decreasing |
|
Home ownership (2019-2020)2 |
Owner without a mortgage – 26.6% |
Decreasing |
Owner with a mortgage – 42.7% |
Stable |
|
Renter – private landlord – 22.5% |
Decreasing |
|
Renter – state of territory housing – 2.8% |
Increasing |
|
Rental affordability index (Q2, 2020)3 |
Perth – Extremely unaffordable |
Decreasing |
Rest of Western Australia – Extremely unaffordable |
Decreasing |
|
|
2ABS 4130.0 – Housing Occupancy and Costs, 2019-20 3Rental Affordability Index, SGS Economics & Planning. |
||
Housing supply
Indicators |
Most current values |
Trend over time |
|---|---|---|
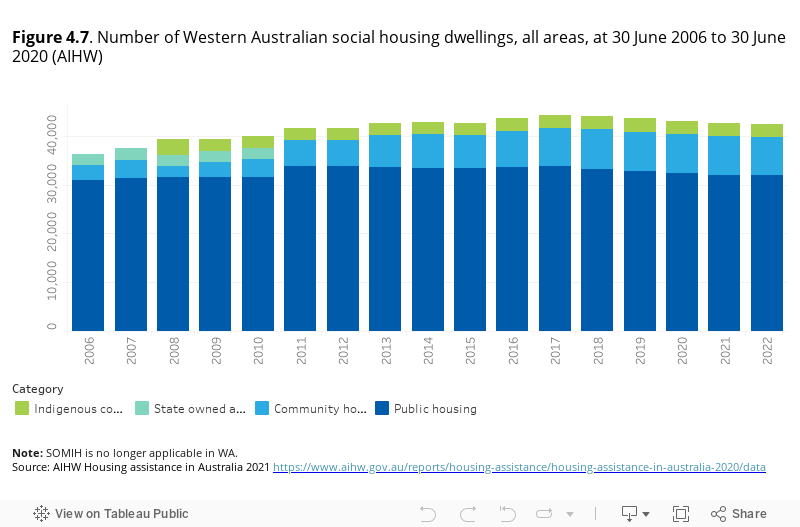
Number of social housing dwellings (2021)1 |
Indigenous community housing – 2,699 |
Decreasing |
Community housing – 7,997 |
Stable |
|
Public housing - 31,919 |
Decreasing |
|
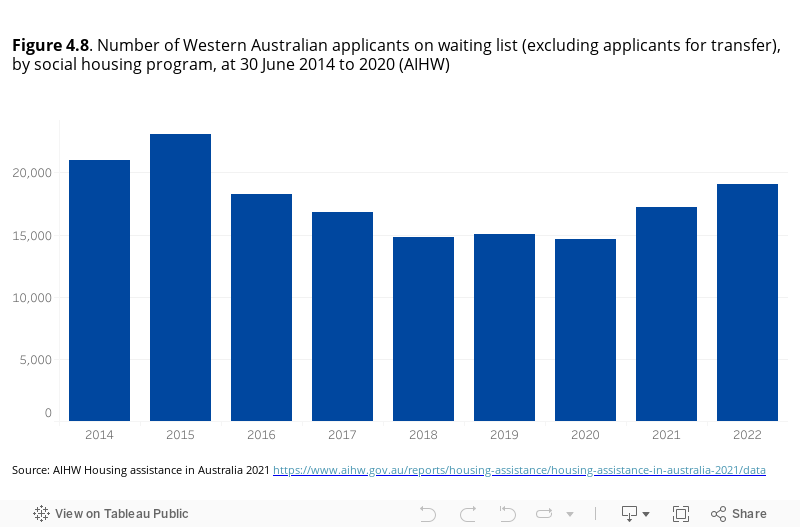
Number of applicants on waiting list (2021)1 |
14,619 |
Stable |
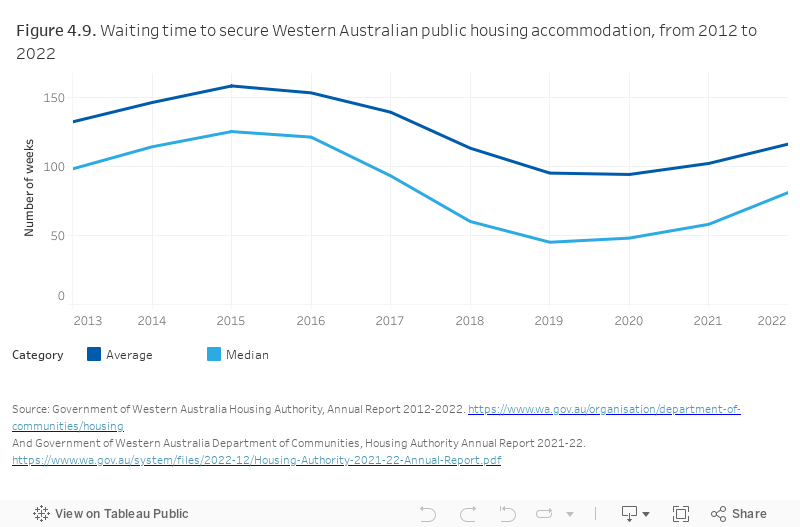
Waiting time to secure public housing accommodation (2020)2 |
Average – 94 weeks |
Stable |
Median – 48 weeks |
Stable |
|
|
2Government of Western Australia Department of Communities, Housing Authority Annual Report 2019-20 |
||
Figure 4.7 indicates that the number of public housing dwellings has remained unchanged since 2011 which has not kept pace with the growth in households. This is evident by the long waiting times for households in need of public housing.
The number of applicants on the public housing waiting list has remained stable from 2018 through to 2020, then increasing in more recent years (Figure 4.8).
The average number of weeks to secure public housing has been increasing since 2020 (Figure 4.9).
Poverty and unemployment
Indicators |
Most current values |
Trend over time |
|---|---|---|
Western Australian poverty rates (2017 - 2018)1 |
50% median income – 12.9% |
Stable |
60% median income – 18.5% |
Stable |
|
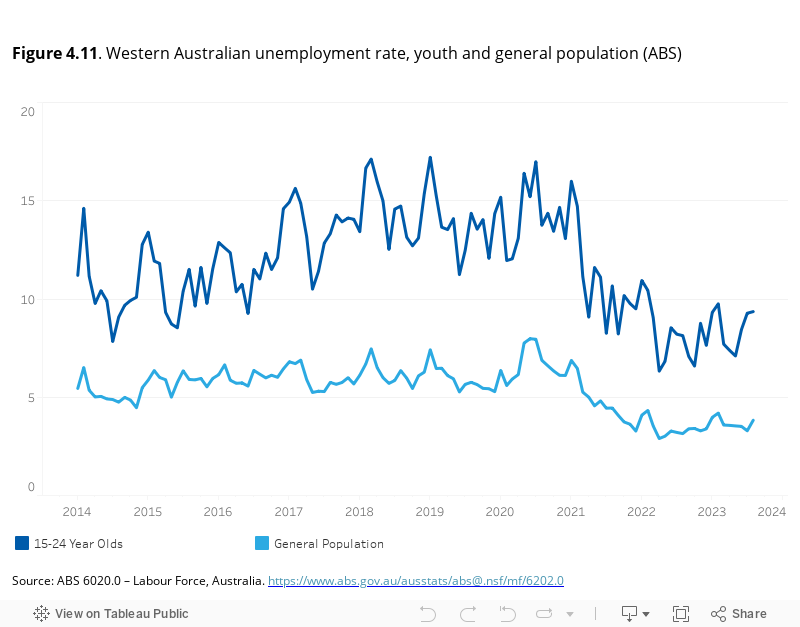
Unemployment rate (2022)2 |
Youth – 6.3% |
Increasing |
General population – 3.0% |
Increasing |
|
|
2ABS 6020.0 – Labour Force, Australia. |
||
Trends in youth unemployment rate and the general population show unemployment on the decline in Western Australia (Figure 4.11).
Young people in custody and out of home care
Indicators |
Most current values |
Trend over time |
|---|---|---|
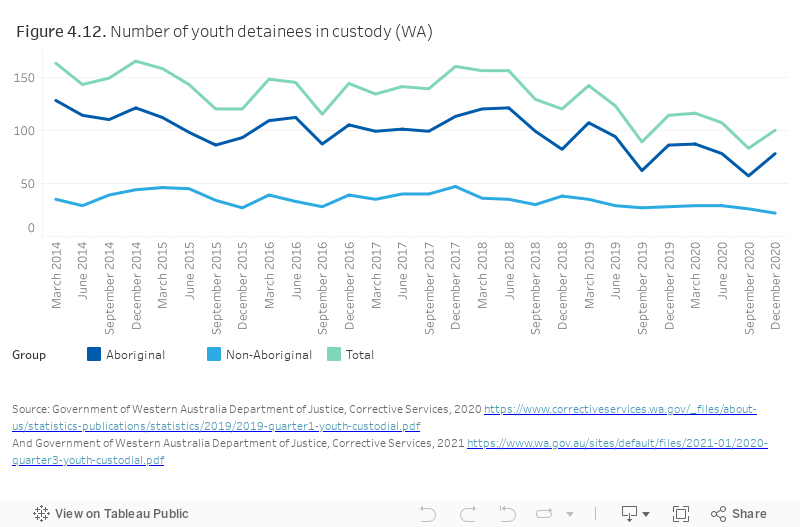
Youth detainees in custody (Sept 2020)1 |
Aboriginal - 57 youth |
Decreasing |
Non-aboriginal - 26 youth |
Decreasing |
|
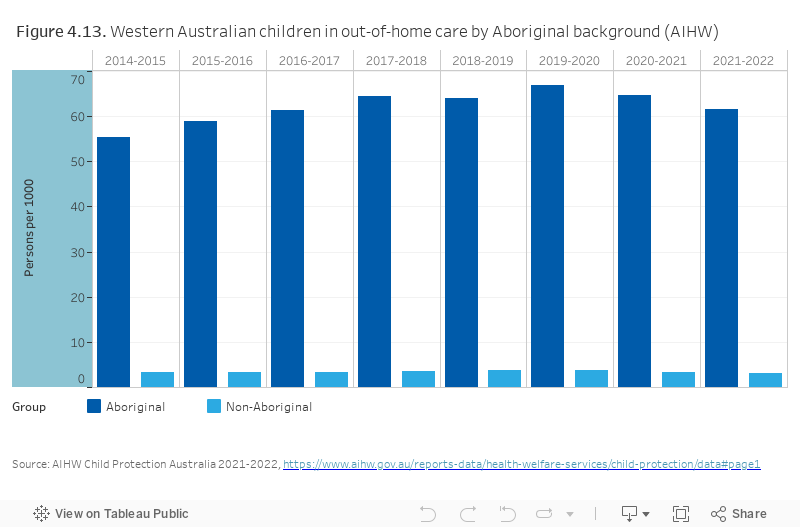
Children in out-of-home care (2020-2021)2 |
Aboriginal – 64.7 per 1000 |
Stable |
Non-aboriginal - 3.4 per 1000 |
Stable |
|
|
2AIHW Child Protection Australia 2020-21. |
||
There is an established link between young people with experience in the justice system and lifetime risk of repeat episodes of homelessness. Figure 4.12 indicates that Aboriginal youth are heavily over-represented in juvenile detention figures. The number of young people in custody has decreased in all three categories between 2014 and 2020, but looks to be increasing again in December 2020.
There is a strong association between individuals who have experienced out-of-home care and lifetime risk of homelessness. The steady trend in the rate of children in out-of-home care among the Aboriginal and/or Torres Strait Islander population illustrated in Figure 4.13 is concerning, however, it seems to be decreasing as of 2021-2022.
Almost half of young people who present alone for Specialist Homelessness Services have long-term or on-going engagement (Figure 4.14).
Physical and mental health
Indicators |
Most current values |
Trend over time |
|---|---|---|
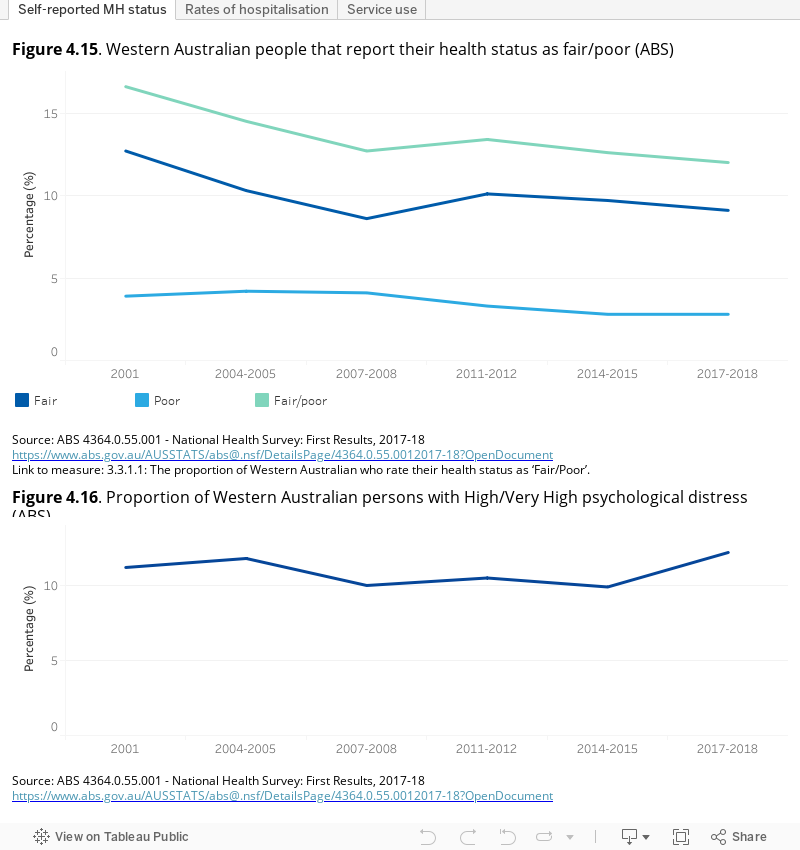
People that report their health status as fair/poor (2017-2018)1 |
Fair/poor - 12.0% |
Decreasing |
Proportion of persons with High/Very High psychological distress (2017-2018)1 |
High/very high - 12.2% |
Increasing |
Hospitalisation rates for a principal diagnosis of mental health related condition (2016-17)2 |
Aboriginal - 33.9 per 1000 |
Stable |
Non-aboriginal - 11.9 per 1000 |
Stable |
|
|
2AIHW, 2020. Aboriginal and Torres Strait Islander Health Performance Framework 2020 |
||
The proportion of persons with High/Very High psychological distress has fluctuated over time with no clear positive or negative general trend. However, it is important to note that the 2017-18 results show the highest percentage of the population with self-assessed high/very high psychological distress since the introduction of the NHS in 2001 (Figure 4.16).
In 2014-15, Indigenous Australians were three times more likely to be hospitalised for mental health issues (Figure 4.17).
Alcohol and drug use
Indicators |
Most current values |
Trend over time |
|---|---|---|
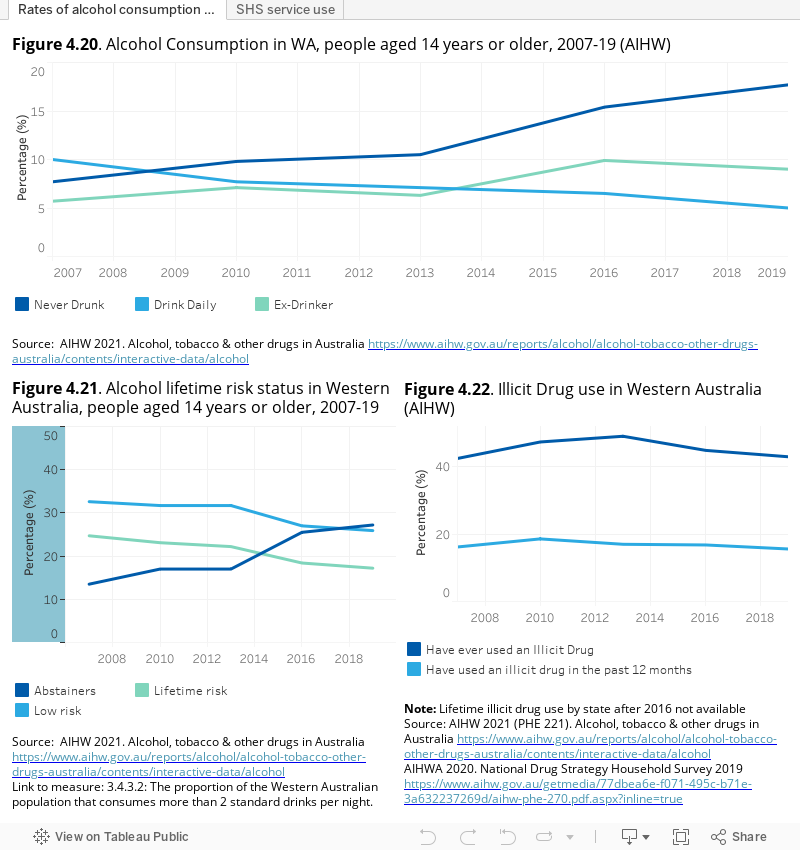
Alcohol Consumption in Western Australia, people aged 14 years or older (2019)1 |
Never drunk – 17.7% |
Increasing |
Drink daily – 5.0% |
Decreasing |
|
Ex-drinker – 9.0% |
Decreasing |
|
Alcohol lifetime risk status, people aged 14 years or older (2019)1 |
Lifetime risk – 17.0% |
Decreasing |
Abstainers – 27.0% |
Increasing |
|
Low risk – 44.4% |
Stable |
|
Illicit Drug use (2019)1 |
Ever used – 43.0% |
Stable |
Used in last 12 months – 16.4% |
Stable |
|
|
|
||
There is a link between problematic alcohol and drug use and risk of homelessness. In addition to the detrimental health impact, substance abuse interacts with a range of other variables including financial stability and access to employment and training. Alcoholism is more prevalent among the homeless population than the general population, acting as both a driver into homelessness and a consequence of homelessness.
In Figure 4.20 there has been a particularly sharp increase from 2013 to 2016 in the percentage of Western Australians who have either ‘never drunk’ or are ‘ex-drinkers.’ Inversely, the percent of those who ‘drink daily’ has shown a gradual decline.
In the period between 2013 and 2016, there has been a positive growth in ‘abstainers’ and a slight fall in both ‘risky’ and ‘low risk’ (suggesting that some from the ‘low risk’ category have moved to ‘abstainers’ rather than shifted to ‘risky’ category). The AIHW has defined ‘risky’ drinking as consuming more than 2 standard drinks on average every day (Figure 4.21).
There is a strong link between problematic drug use and risk of homelessness. The rate of those that have used or continue to use an illicit drug in WA has remained relatively constant (Figure 4.23).
One third of Specialist Homelessness Services clients between the ages of 25-34 present with problematic drug or alcohol use (Figure 4.24).
Domestic violence
Indicators |
Most current values |
Trend over time |
|---|---|---|
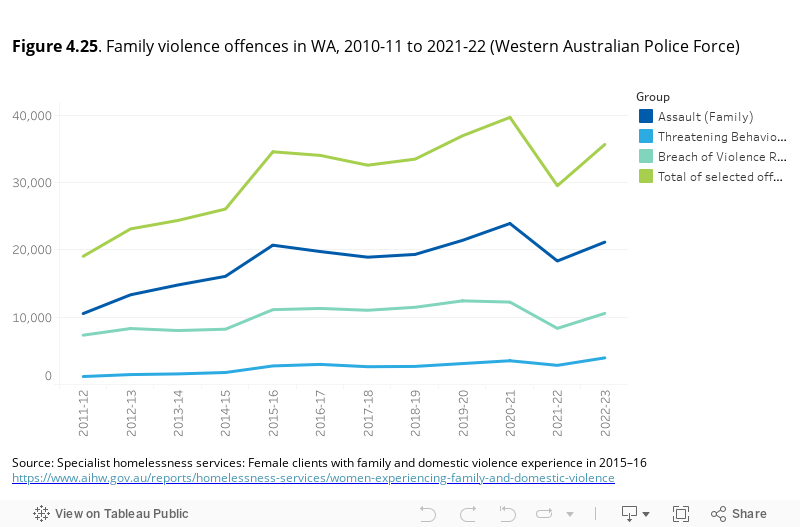
Family violence offences in Western Australia (2021-22)1 |
Assault – 18,359 |
Decreasing |
Threatening behaviour – 2,846 |
Decreasing |
|
Breach of violence restraining order – 8,341 |
Decreasing |
|
|
|
||
Domestic and family violence is the leading cause of homelessness for women and their children. Reported family violence offences have increased by more than 100 per cent in the past decade. A peak is observed in 2019-20 which is attributable to an increase in family assault and breach of violence restraint orders. Only threatening behaviour was not seen to escalate. When interpreting the peak observed in 2019-2020 it is necessary to consider the potential impact of COVID-19 on trends of family violence offences. The following peak in 2022-2023 could be attributed to an increased knowledge and confidence in reporting the offences following the MeToo movement (Figure 4.25).
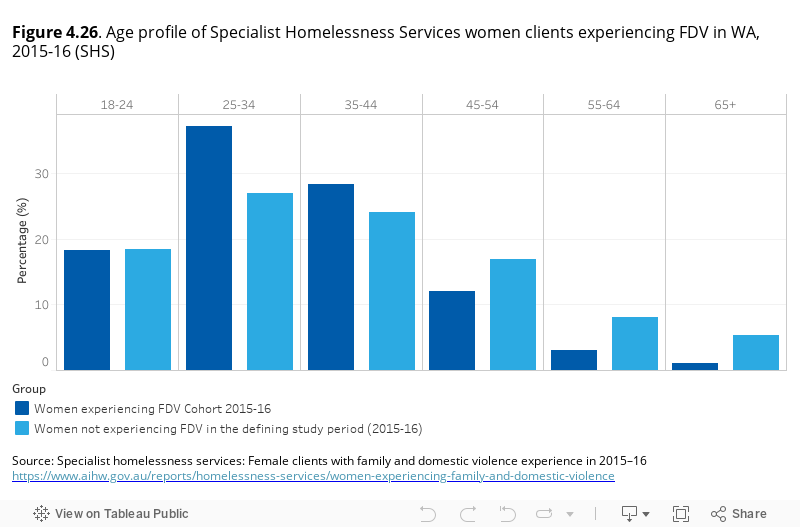
Over one-third of Specialist Homelessness Services female clients between the ages of 25-34 present experiencing family and domestic violence (Figure 4.26).
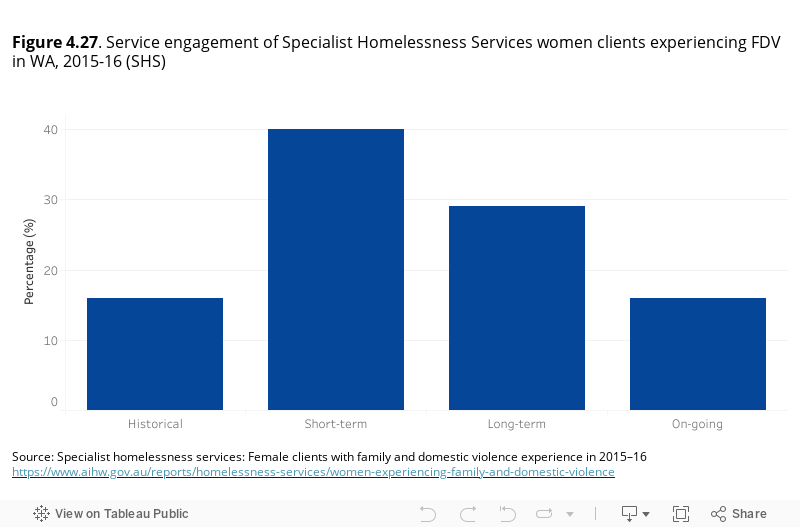
Forty-five percent of women clients who are experiencing family and domestic violence are engaged long-term or on-going with specialist homelessness services (Figure 4.27).