Western Australian Alliance to End Homelessness Dashboard |
|
A decade of community data collection of people experiencing homelessness
The Advance to Zero database is a community-based data set which provides substantial detail and context about people experiencing homelessness are located by and/or engage with homelessness services. In Western Australia, 3,183 surveys have been conducted with people experiencing homelessness from 2012 to 30th June 2022, mostly living in Perth.
Key findings
Profile of homeless:
62% male, average age 40 years
Women on the whole were younger than their male counterparts and experienced more significant mental health and general health issues as well as violence on the streets.
1 in 6 aged under 24.
52% were rough sleeping (eg streets, parks, cars), 24% in temporary accommodation (eg couch surfing).
92% have regular income, 41% have enough money to meet all expenses and debt.
For individuals, the mean time spent homeless was 64.1 months – over 5 years; for families, mean time spent homeless was 68.2 months – over 5.5 years. Looking at 2020-2022 data only, the mean time spent homeless has increased to 76.3 months for individuals. Experiences while homeless:
Many people who are homeless have experienced dangerous events while homeless: 56% have been a victim of attack; 50% have threatened to harm themselves or others; 35% have engaged in risky behaviour such as exchange sex for money, run drugs, have unprotected sex with strangers or share a needle; and 33% had a person forcing them to do things they don’t want to do.
50.3% of Western Australia rough sleepers reported having been discriminated against with respect to homelessness services or housing. Health problems:
58.4% report dental problems, 30% dehydration, 19.9% foot/skin infections.
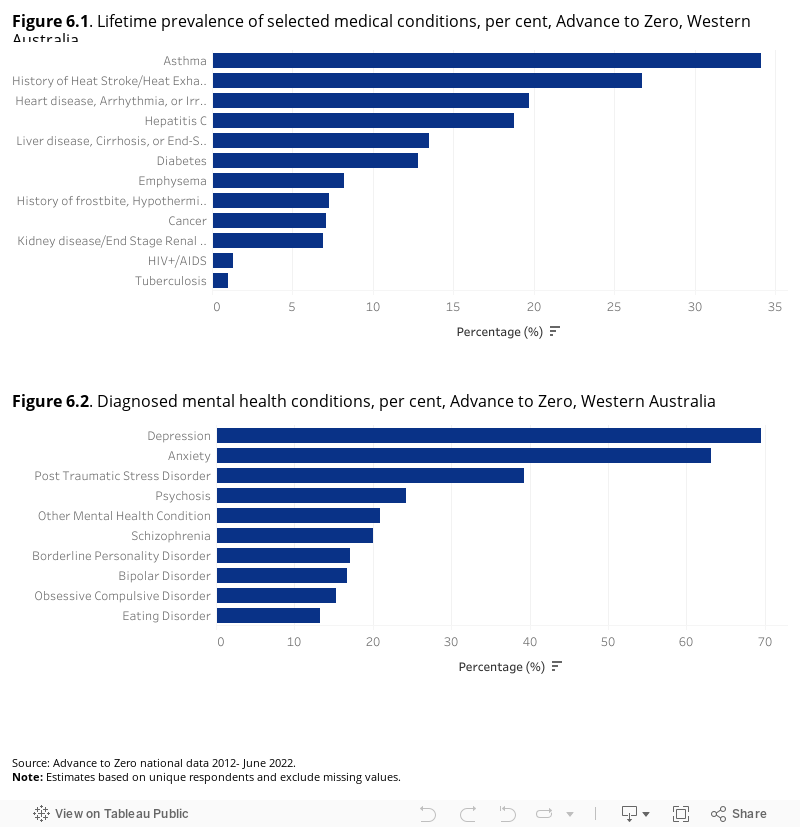
34.1% report asthma, 27% heat stroke, 18.8% hepatitis C, 19.7% heart disease, 13.5% liver disease, 12.8% diabetes.
69.5% depression, 63.2% anxiety, 39.3% PTSD, 24.3% psychosis.
72.0% problematic drug or alcohol use, 39.1% consuming alcohol and/or drugs daily.
35% serious brain injury or head trauma. Interactions with health system:
51.6% had been hospitalised in the previous six months, 66.1% reported they had used Accident and Emergency, 55.6% had been taken to hospital by ambulance.
The mean cost of use of selected healthcare services in the six months prior to survey among Western Australian respondents in the Advance to Zero database was $14,449. Rough sleepers reported higher utilisation of healthcare services than those who were not sleeping rough, thus their costs are slightly higher at $15,891 overall. Interactions with justice system:
63.6% reported that they had interacted with police in the previous six months.
55.6% of respondents had been imprisoned at some point in their life.
The experience of homelessness
Over half (51.6%) of respondents most often slept rough. Almost one quarter (24.1%) slept in temporary accommodation most frequently, such as by couchsurfing, 9.7% were most often in crisis or emergency accommodation, 5.7% in short-term accommodation such as boarding houses and hostels, and 3.2% most frequently slept in institutional accommodation such as hospitals and prison.
A small proportion (1.5%) of respondents were permanently housed, most likely reflecting the use of the VI-SPDAT in housing programs such as 50 Lives, 50 Homes. One per cent of respondents were in ‘other’ accommodation, and 3.1% of surveys did not indicate where the person slept most frequently.
Number |
Per cent |
|
|---|---|---|
Sleeping rough |
1642 |
51.7 |
Crisis and emergency accommodation |
309 |
9.7 |
Temporary accommodation (e.g., couch surfing) |
768 |
24.1 |
Short-term accommodationn (e.g., boarding house, hostel, caravan) |
180 |
5.7 |
Institutional accomodation (e.g., hospital, drug and alcohol facility, prison) |
103 |
3.2 |
Permanently housed |
47 |
1.5 |
Other |
34 |
1.1 |
Missing |
100 |
3.1 |
Total |
3183 |
100.0 |
|
|
||
For individuals, the mean time spent homeless was 64.1 months – over 5 years; for families, mean time spent homeless was 68.2 months – over 5.5 years. Looking at 2020-2022 data only, the mean time spent homeless has increased to 76.3 months for individuals.
Individuals |
Families |
|
|---|---|---|
N |
2245 |
465 |
Mean (months) |
64.1 |
68.2 |
SD |
80.6 |
82.6 |
Median |
36.0 |
48.0 |
|
|
||
Experiences while homeless
Description of dangerous event |
Western Australian |
|---|---|
Been a victim of attack since becoming homeless |
56.2% |
Threatened or tried to harm themselves or others since becoming homeless |
49.9% |
Had a person forcing them to do things that they do not want to do |
32.8% |
Engaged in risky behaviour such as exchange sex for money, run drugs, have unprotected sex with strangers or share a needle |
35.2% |
|
|
|
Discrimination is a common experience for people who experience homelessness across 2012-2022, half (50.3%) of Western Australia rough sleepers reported having been discriminated against with respect to homelessness services or housing. Rough sleepers reported the highest rate of discrimination (54.4%), followed by other gender identity (71.4%), and females (52.2%).
Health problems
The VI-SPDAT asks participants whether they currently experience the following health conditions: cellulitis; foot or skin infections; scabies; dehydration; epilepsy or dental problems. Dental problems were experienced by more than half (58.4%) of Western Australian respondents; dehydration by 30.2%; foot or skin infections by 19.9%; chronic digestive conditions by 8.8% and epilepsy by 8.3%. Cellulitis and scabies were less common with reports by only 6.3% and 4.1% of respondents respectively.
The most prevalent long term physical health condition was asthma which was reported by 34.1% of respondents. Other commonly reported disorders were heat stroke or heat exhaustion (26.7%), heart disease, arrhythmia, or irregular heartbeat (19.7%), and hepatitis C (18.8%). The prevalence of conditions in respondents was generally higher than that in the general population. For example, the prevalence of cancer in respondents was 6.7% which is more than double the prevalence of 3% documented for the general population. Similarly, the prevalence of diabetes in respondents (13.2%) was more than double the rate of 4.3% reported for the general Australian population.
The VI and VI-SPDAT assess mental health issues by asking about symptoms and help seeking, and whether respondents have been diagnosed with certain conditions. With regard to symptoms, more than two thirds (67.6%) of Western Australian respondents reported that they have problems concentrating or remembering things, more than half (55.2%) had spoken with a psychiatrist, psychologist or mental health professional in the last six months, and nearly half (48.8%) had gone to an emergency department (ED) due to not feeling emotionally well or because of their nerves. In addition, 35.0% of Western Australian respondents reported that they had been taken to hospital against their will for mental health reasons and 31.0% reported that they had been told that they have a learning or developmental disability.
More than two-thirds of respondents reported having depression (69.5%) and anxiety (63.2%). Post-traumatic stress disorder was also common, with 39.3% of people reporting diagnosis. Almost one quarter (24.3%) of Western Australian respondents had been diagnosed with psychosis, and 1 in 5 had been diagnosed with schizophrenia (20.0%), bipolar disorder (16.7%) and borderline personality disorder (17.1%).
Over seventy per cent (72.0%) of respondents reported that they had experienced or been told that they had problematic drug or alcohol use or abused drugs or alcohol. Almost 40% (39.1%) reported that they had consumed alcohol or drugs almost every day or every day during the past month whilst a similar percentage (36.7%) reported that they had used injection drugs or shots in the last six months. One in four respondents (43.5%) reported that they had been treated for drug or alcohol problems and returned to drinking or using drugs.
More than a third (35.0%) of Western Australian respondents reported serious brain injury or head trauma and nearly a third (31.0%) of respondents reporting a learning or developmental disability. Veterans reported a higher rate of serious brain injury or head trauma than non-veterans (50.4% versus 34.0%). Rough sleepers reported a higher rate of brain injuries than non-rough sleepers (39.5% versus 29.9%). By sex, the rate of self-report of serious brain injury or head trauma was highest in males (36.9%), followed by females (32.6%) and lastly those of other gender identity (20.5%).
Interactions with health
Approximately half (51.6%) of the respondents had been hospitalised in the previous six months, 66.1% reported they had used Accident and Emergency, and 55.6% had been taken to hospital by ambulance. To calculate the estimated cost of the self-reported health service utilisation of Western Australian respondents we used the Report on Government Services 2021 average cost of a public hospital separation in Western Australia ($5,519) and A&E visit not resulting in admission ($705). The estimated cost per ambulance service ($1,029) is based on a study of Sydney Hospitals by the Independent Hospital Pricing Authority.
The mean cost of use of selected healthcare services in the six months prior to survey among Western Australian respondents in the Advance to Zero database was $14,449, comprised of $10,486 associated with hospitalisations, $2,327 with Accident and Emergency Presentations, and $1,636 with ambulance (Table 21). Rough sleepers reported higher utilisation of healthcare services than those who were not sleeping rough, thus their costs are slightly higher at $15,891 overall ($11,424 hospital; $2,686 A&E; $1,780 ambulance). Table 21 outlines mean frequency and cost of service use of Western Australian respondents in the Advance to Zero database over the six months prior to survey, by rough sleeping status.
| Respondent group | Hospitalisation cost per incident: $5,519 | A&E Cost per incident: $705 | Ambulance cost per incident: $1,029 | Total | |||
|---|---|---|---|---|---|---|---|
Mean no. incidents |
Mean cost/ person |
Mean no. incidents |
Mean cost/person |
Mean no. incidents |
Mean cost/ person |
Mean cost/ person |
|
Rough sleepers |
2.07 |
$11,424 |
3.81 |
$2,686 |
1.73 |
$1,780 |
$15,891 |
Not sleeping rough |
1.71 |
$9,437 |
2.76 |
$1,946 |
1.43 |
$1,471 |
$12,855 |
Rough sleeping status not specified |
2.09 |
$11,535 |
3.28 |
$2,312 |
1.89 |
$1,945 |
$15,792 |
Overall |
1.90 |
$10,486 |
3.3 |
$2,327 |
1.59 |
$1,636 |
$14,449 |
|
|
|||||||
Interactions with Justice
The majority of respondent reported that they had interacted with police in the previous six months (63.6%) and 55.6% of respondents had been imprisoned at some point in their life.