Western Australian Alliance to End Homelessness Dashboard |
|
Addressing underlying drivers of homelessness in WA
Target 4
The underlying causes that result in people becoming homeless have been met head-on, resulting in a reduction by more than half in the inflow of people and families into homelessness in any one year
The causes of homelessness are complex, encompassing a broad range of individual and structural determinants, including housing availability and affordability, economic and employment opportunities (or lack thereof), physical and mental health outcomes, domestic and family violence, and social and community connections.
Housing affordability
Indicators |
Most current values |
Trend over time |
|---|---|---|
Proportion experiencing household stress in Perth (2017 - 2020)1 |
10.7% |
Increasing |
Proportion of low-income rental households spending more than 30 per cent of their gross income on housing costs (2019-2020)2 |
Perth - 36.7%
|
Decreasing |
Proportion of low income households remaining in housing stress from one year to the next (2017-2020)1 |
Australia – 48.3% |
Increasing |
Housing affordability (2019-2020)2 |
Owner – 2.9% |
Stable |
Owner with a mortgage – 14.0% |
Decreasing |
|
Renter – private landlord – 17.4% |
Stable |
|
Renter – state of territory housing – 20.9% |
Decreasing |
|
Home ownership (2019-2020)2 |
Owner without a mortgage – 26.6% |
Decreasing |
Owner with a mortgage – 42.7% |
Stable |
|
Renter – private landlord – 22.5% |
Decreasing |
|
Renter – state of territory housing – 2.8% |
Increasing |
|
Rental affordability index (Q2, 2020)3 |
Perth – Extremely unaffordable |
Decreasing |
Rest of Western Australia – Extremely unaffordable |
Decreasing |
|
|
2ABS 4130.0 – Housing Occupancy and Costs, 2019-20 3Rental Affordability Index, SGS Economics & Planning. |
||
Housing supply
Indicators |
Most current values |
Trend over time |
|---|---|---|
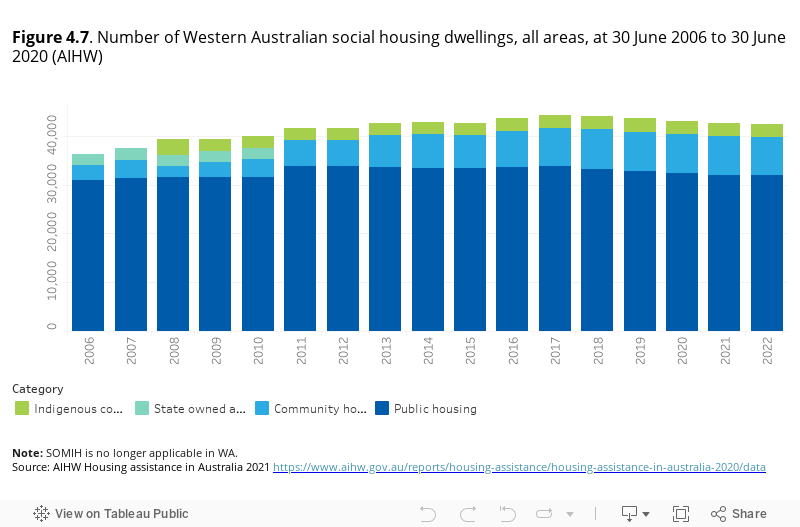
Number of social housing dwellings (2021)1 |
Indigenous community housing – 2,699 |
Decreasing |
Community housing – 7,997 |
Stable |
|
Public housing - 31,919 |
Decreasing |
|
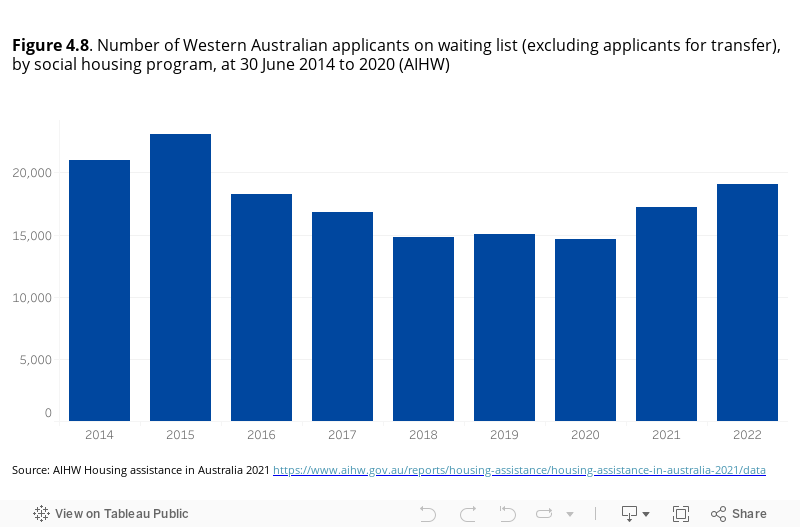
Number of applicants on waiting list (2021)1 |
14,619 |
Stable |
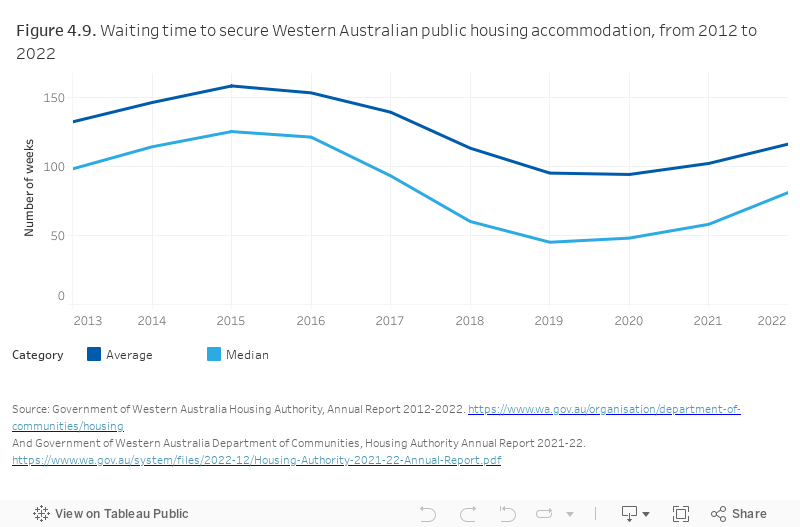
Waiting time to secure public housing accommodation (2020)2 |
Average – 94 weeks |
Stable |
Median – 48 weeks |
Stable |
|
|
2Government of Western Australia Department of Communities, Housing Authority Annual Report 2019-20 |
||
Figure 4.7 indicates that the number of public housing dwellings has remained unchanged since 2011 which has not kept pace with the growth in households. This is evident by the long waiting times for households in need of public housing.
The number of applicants on the public housing waiting list has remained stable from 2018 through to 2020, then increasing in more recent years (Figure 4.8).
The average number of weeks to secure public housing has been increasing since 2020 (Figure 4.9).